A matrix (crosstab) report contains one row of labels, one column of
labels, and information in a grid format that is related to the row and
column labels. In other words, a matrix report displays the data in a
grid. A distinguishing feature of matrix reports is that the number of
columns is not known until the data is fetched from the database.
A simple matrix report might look like the one below, where the jobs are
fetched dynamically for the first row and the departments are fetched
dynamically for the first column. The salaries of the employees with the
job in a particular department are places along the grid. The aggregate
totals are displayed in the last row and last column.
Dept
|
Analyst
|
Clerk
|
Manager
|
Total
|
10
|
|
1300
|
2450
|
3750
|
20
|
6000
|
1900
|
2975
|
10875
|
30
|
|
950
|
2850
|
3800
|
Total
|
6000
|
4150
|
8275
|
18425
|
Cross-Tabs
are covered under advanced report layouts in XML Publisher. It would be
helpful to first read the XMLP basics before continuing with
cross-tabs.
Cross-Tabs
feature in XML Publisher is synonymous to Matrix reports in Oracle
Reports 6i. I will first explain the example given in XML Publisher User
Guide under the section "Creating RTF Template > Advanced Report layouts> Cross-Tab Support".
The RTF template given in user guide doesn’t give the desirable
results, so I will explain how the code should be modified to get the
correct results.
XML Data File:The
following is the xml data file used for our example. The xml data file
contains the quarter sales results of different industries over a period
of time. I have slightly modified the data such that there are no
quarter sales results for “Home Furnishing” industry for the year 2003.
<ROWSET>
<RESULTS>
<INDUSTRY>Motor Vehicle Dealers</INDUSTRY>
<YEAR>2005</YEAR>
<QUARTER>Q1</QUARTER>
<SALES>1000</SALES>
</RESULTS>
<RESULTS>
<INDUSTRY>Motor Vehicle Dealers</INDUSTRY>
<YEAR>2005</YEAR>
<QUARTER>Q2</QUARTER>
<SALES>2000</SALES>
</RESULTS>
<RESULTS>
<INDUSTRY>Motor Vehicle Dealers</INDUSTRY>
<YEAR>2004</YEAR>
<QUARTER>Q1</QUARTER>
<SALES>3000</SALES>
</RESULTS>
<RESULTS>
<INDUSTRY>Motor Vehicle Dealers</INDUSTRY>
<YEAR>2004</YEAR>
<QUARTER>Q2</QUARTER>
<SALES>3000</SALES>
</RESULTS>
<RESULTS>
<INDUSTRY>Motor Vehicle Dealers</INDUSTRY>
<YEAR>2003</YEAR>
<QUARTER>Q1</QUARTER>
<SALES>2500</SALES>
</RESULTS>
<RESULTS>
<INDUSTRY>Home Furnishings</INDUSTRY>
<YEAR>2005</YEAR>
<QUARTER>Q1</QUARTER>
<SALES>1200</SALES>
</RESULTS>
<RESULTS>
<INDUSTRY>Home Furnishings</INDUSTRY>
<YEAR>2003</YEAR>
<QUARTER>Q1</QUARTER>
<SALES>1500</SALES>
</RESULTS>
</ROWSET>
From
this xml we will generate a report that shows each industry and total
the quarter sales by year as shown in the following figure:
Template from the User Guide:
The template to generate this report is shown in the following figure.
You can download the template from this link
The form field entries are shown in the subsequent table.
Using the above template, the report will display the data as below.
But
the output we get using the template mentioned in the user guide is not
proper, we didn’t have the quarter sales results for the year 2004 but
the value 1500 which has to be shown under 2003 column is actually shown
under 2004.
The
reason for the erroneous result is, if the cell value (or results of
the industry for a year) doesn’t exist, the cell value would be null. As
the cell value is null, the table cell is getting collapsed and the
actual values are shown side by side. To overcome the problem, we have
to check if industry has results in that year or not.
So
to overcome this problem, we have to check if industry exists in that
year or not. This can be done, by storing the industry value in a local
variable and use this value to compare to the value under the INDUSTRY
element if at all it exists for a year. If the values are same, the
quarter sales result is displayed under the year else a null value is
displayed. By including the null value in the table cells even if the
industry element doesn’t exist for a year, the correct values are
displayed.
Storing of industry value is done in for field field before INDUSTRY form field. Below is the form field code snippet:
<?for-each-group@section:RESULTS;./ INDUSTRY?>
<?variable@incontext:IND;INDUSTRY?>
In the above code, I’m storing the industry name i.e INDUSTRY in variable called IND.
Now when I display the corresponding quarter sales result for a year, I will check if the industry exists for that year using count function. If the year doesn’t exist in industry, I won’t display any value for sales result. This is handled by code:
<?if:count(current-group()[INDUSTRY=$IND])?>
<?sum(current-group()[INDUSTRY=$IND]/SALES)?>
<?end if?>
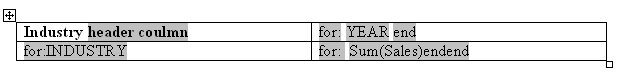
Modified RTF template:
The form field entries are shown in the subsequent table. The modified xml tags are shown in bold.
Default Text Entry
|
Form Field Help Text
|
Description
|
header column
|
<?horizontal-break-table:1?>
|
Defines the first column as a header that should repeat
if the table breaks across pages. 1 in the tag refers the number of columns of the header that should repeat.
|
for:
|
<?for-each-group@column: RESULTS;YEAR?>
|
Uses the regrouping syntax (see Regrouping the XML
Data, page 2-74) to group the data by YEAR; and the
@column context command to create a table column
for each group (YEAR).
|
YEAR
|
<?YEAR?>
|
Placeholder for the YEAR element.
|
end
|
<?end for-each-group?>
|
Closes the for-each-group loop.
|
for:
|
<?for-each-group@section:RESULTS;./ INDUSTRY?>
<?variable@incontext:IND;INDUSTRY?>
|
Begins the group to create a table row for each
INDUSTRY. Store the industry value in a variable IND using variable
tag. When displaying the corresponding results for a year, the value in
the variable IND is used to compare the value in the INDUSTRY element.
|
INDUSTRY
|
<?INDUSTRY?>
|
Placeholder for the INDUSTRY element.
|
for:
|
<?for-each-group@cell://RESULTS;YEAR?>
|
Uses the regrouping syntax to group the data by YEAR; and the
@cell context command to create a table cell for each
group (YEAR).
|
sum(Sales)
|
<?if:count(current-group()[INDUSTRY=$IND])?>
<?sum(current-group()[INDUSTRY=$IND]/SALES)?>
<?end if?>
|
Compare
the industry with the value in the variable IND, if the count>0,
then it returns TRUE, so the code written inside IF clause executes i.e.
Sums the sales for the current group (YEAR) is displayed in the cell.
|
end
|
<?end for-each-group?>
|
Closes the for-each-group statement.
|
end
|
<?end for-each-group?>
|
Closes the for-each-group statement.
|
After the above modifications to the template, the result can be seen below:
For additional reading on “Regrouping the XML Data” and “Using Context Commands”, read the sections "Creating RTF Template > Data Handling > Regrouping the XML Data" and "Creating RTF Template > Advanced Design Options > Using Context Commands" respectively in the XMLP user guide.
You find one more example on cross-tabs here.
RTF Template for that example can be downloaded from here